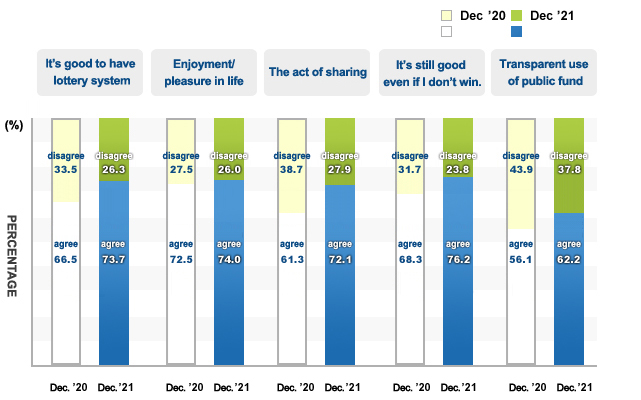
According to overall evaluation, empathy with “It's good to have lottery system” is 73.7%.
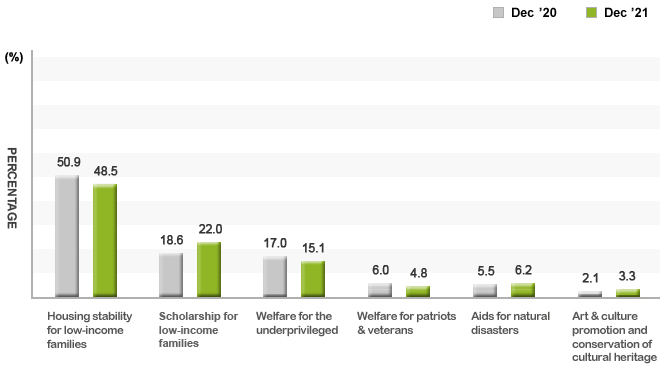
Priority of lottery fund use
The sectors which are in desperate need of lottery funds are “housing stability for low-income families (48.5%)” and “scholarship for low-income families (22.0%)”.
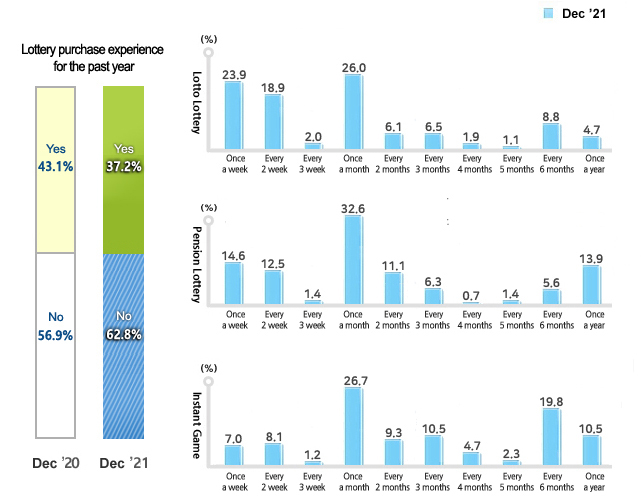
Lottery purchase experience for the past year
When asked if they bought a lottery ticket at least once for the past year, 62.8% responded ‘YES’.
When asked what lottery ticket and how often they bought, ‘once a month’ was the highest with 26.0%, followed by ‘once a week (23.9%)’ and ‘biweekly (18.9%)’ in Lotto.
In Pension Lottery and Instant Game, ‘once a month’ was the highest with 32.6% and 26.7% respectively.
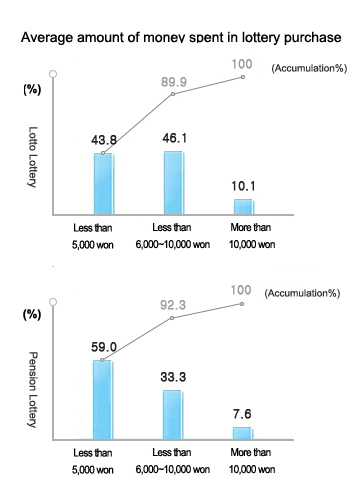
Amount of money spent in lottery purchase
Majority of Lotto and Penstion Lottery ticket buyers spent KRW 10,000 or less on average at a time.
In average, KRW 9,255 and KRW 8,910 are spent for Lotto and Pension Lottery tickets each.
Amount of money spent in lottery purchase
Category
Average (won)
Lotto Lottery
Total
9,255
Sex
Male
9,640
Female
8,748
Age
19~29yrs
9,352
30s
9,260
40s
8,660
50s
9,544
60 and above
9,488
Amount of money spent in lottery purchase-Pension Lottery
Category
Average (won)
Pension Lottery
Total
8,910
Sex
Male
8,032
Female
10,612
Age
19~29yrs
9,167
30s
7,857
40s
7,564
50s
8,581
60 and above
10,643
※ This survey of 1,020 men and women aged 19 years and
above was conducted by Ipsos for 24 days between October 25th,
2021 to November, 18th, 2021, (±3.1 sampling error, 95% confidence
level)