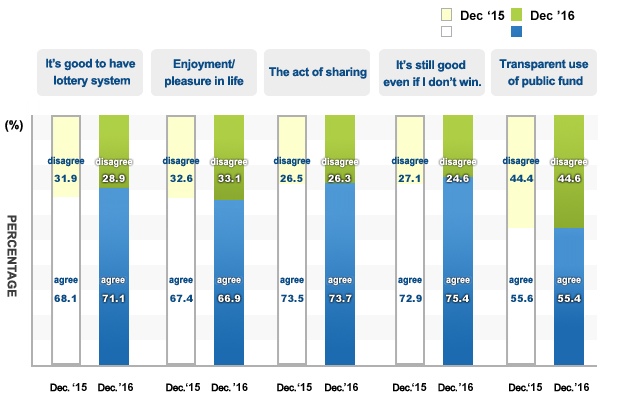
According to overall evaluation, empathy with “It's good to have lottery system” is the highest with 71.1% since 2008.
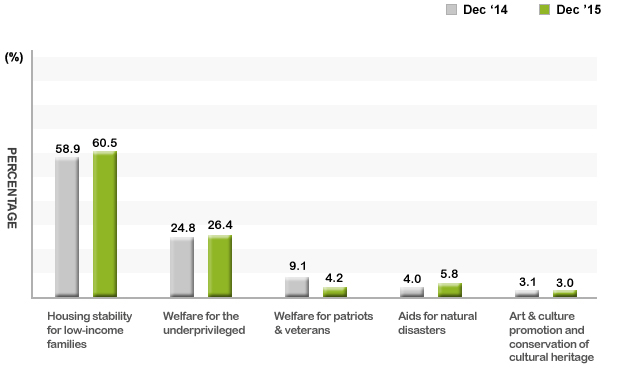
Priority of lottery fund use
The sectors which are in desperate need of lottery funds are “housing stability for low-income families (58.3%)” and “welfare for the underprivileged (24.7%)”.
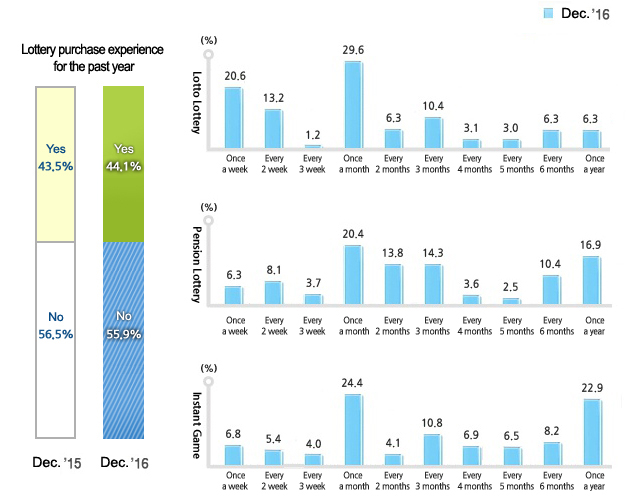
Lottery purchase experience for the past year
When asked if they bought a lottery ticket at least once for the past year, 55.9% responded ‘YES’. The figure is similar to the prior year.
When asked what lottery ticket and how often they bought, ‘once a month’ was the highest with 29.6%, followed by ‘once a week (20.6%)’ and ‘biweekly (13.2%)’ in Lotto.
In Pension Lottery and Instant Game, ‘once a month’ was the highest with 20.4% and 24.4% respectively.
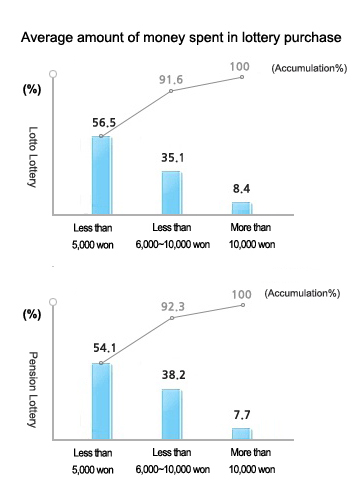
Amount of money spent in lottery purchase
Majority of Lotto and Penstion Lottery ticket buyers spent KRW 10,000 or less on average at a time.
In average, KRW 8,402 and KRW 8,546 are spent for Lotto and Pension Lottery tickets each.
Amount of money spent in lottery purchase
Category
Average (won)
Lotto Lottery
Total
8,402
Sex
Male
9,014
Female
7,478
Age
19~29yrs
8,382
30s
8,369
40s
9,289
50s
7,873
60 and above
7,909
Amount of money spent in lottery purchase-Pension Lottery 520
Category
Average (won)
Pension Lottery 520
Total
8,546
Sex
Male
8,222
Female
8,941
Age
19~29yrs
6,406
30s
6,769
40s
12,497
50s
7,091
60 and above
7,375
※ This survey of 1,027 men and women aged 19 years and
above was conducted by Gallup for 34 days between October 24th,
2016 to November, 28th, 2016, (±3.1 sampling error, 95% confidence
level)