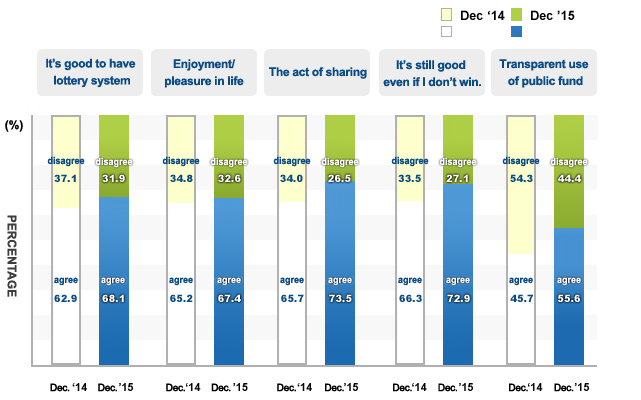
According to overall evaluation, empathy with “It's good to have lottery system” is the highest with 68.1% since 2008.
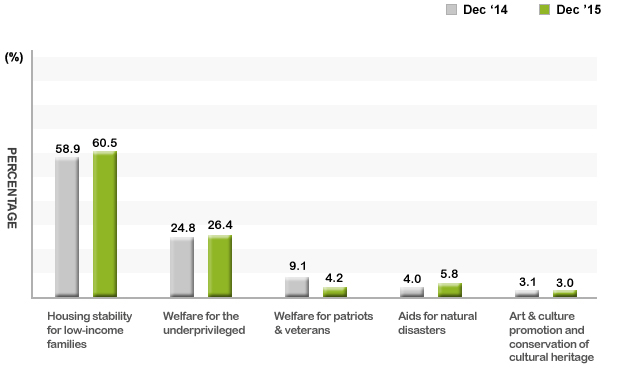
Priority of lottery fund use
The sectors which are in desperate need of lottery funds are “housing stability for low-income families (60.5%)” and “welfare for the underprivileged (26.4%)”.
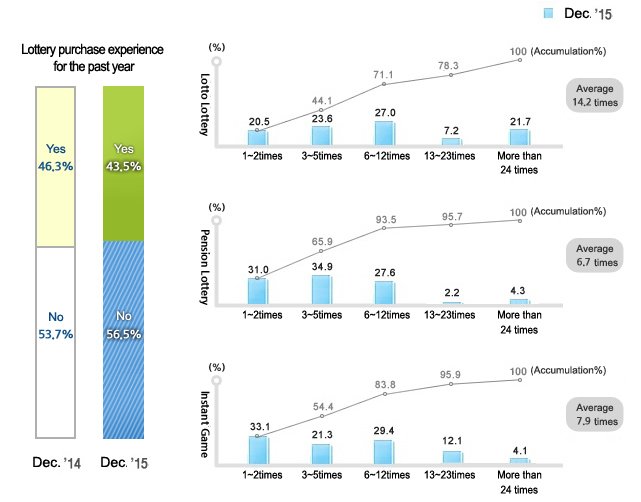
Lottery purchase experience for the past year
When asked if they bought a lottery ticket at least once for the past year, 56.5% responded ‘YES’. The figure slightly increased from the prior year (by 2.8%).
When asked what lottery ticket and how often they bought, ‘Lotto’ was the highest with 14.2 times, followed by ‘Instant Games (6.7 times)’ and ‘Pension Lottery (5.6 times)’.
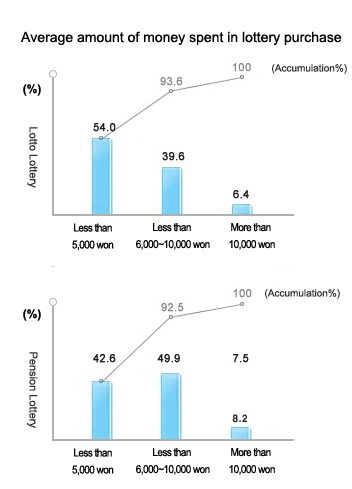
Amount of money spent in lottery purchase
Majority of Lotto and Penstion Lottery ticket buyers spent KRW 10,000 or less on average at a time.
In average, KRW 8,230 and KRW 8,169 are spent for Lotto and Pension Lottery tickets each.
Amount of money spent in lottery purchase
Category
Average (won)
Lotto Lottery
Total
8,230
Sex
Male
9,159
Female
6,849
Age
19~29yrs
8,012
30s
8,418
40s
8,440
50s
8,817
60 and above
7,262
Amount of money spent in lottery purchase-Pension Lottery 520
Category
Average (won)
Pension Lottery 520
Total
8,169
Sex
Male
8,151
Female
8,210
Age
19~29yrs
7,075
30s
9,486
40s
6,831
50s
10,193
60 and above
7,334
Lottery purchase frequency in 1 year
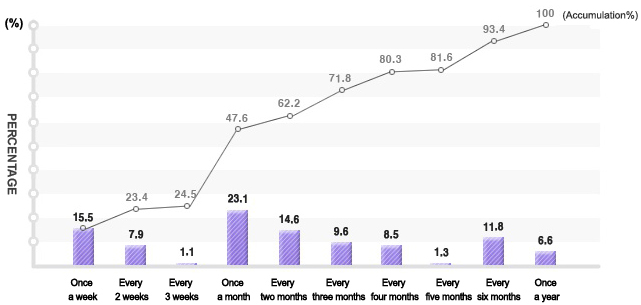
14.0% of the buyers responded, “I buy a lottery ticket every week”, and the figure is similar to the previous year (15.5%).
Lottery purchase frequency for the past year
By class (unit%)
Lottery purchase frequency for the past year
Category
People who purchase lottery in the past year
Once a week
Every 2~3 weeks
Once a month
Less than once a month
Total
14.0
14.8
22.7
48.5
Sex
Male
19.8
18.0
23.2
38.9
Female
5.6
10.1
21.8
62.4
Age
19~29yrs
5.8
12.8
19.7
61.8
30s
15.5
13.6
25.4
45.6
40s
14.8
15.6
17.8
51.8
50s
15.7
17.6
23.2
43.6
60 and above
16.3
13.7
28.5
41.7
※ This survey of 1,000 men and women aged 19 years and
above was conducted by Gallup for 28 days between November 2th,
2015 to November, 30th, 2015, (±3.1 sampling error, 95% confidence
level)