Recognition on lottery
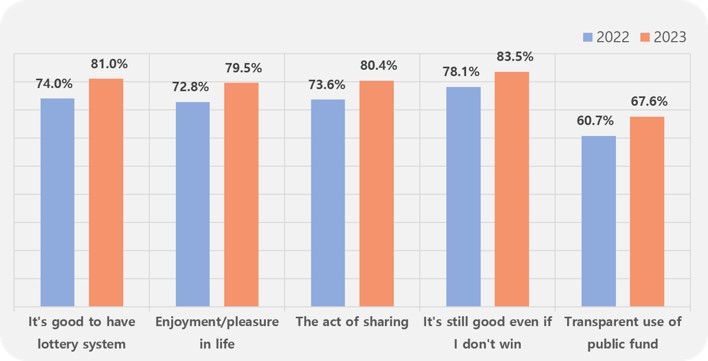
- The consensus on ‘Considering various aspects, it is good to have a lottery’ was 81.0%, which is 0.7 percentage points higher than last year (70.4%).
- In the comprehensive evaluation, not only those who purchased within one year but also non-purchasers expressed the consensus that 'It's good to have a lottery ticket.'
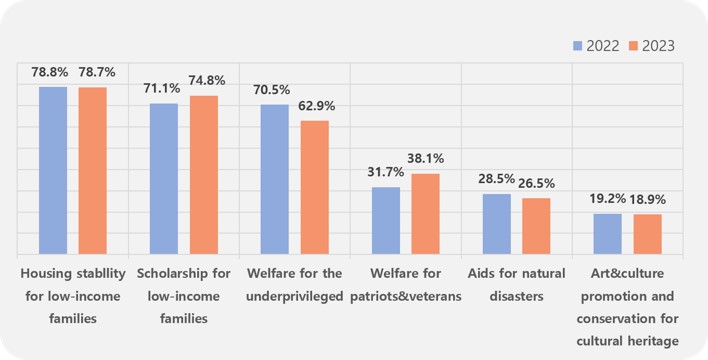
Priority in Lottery Fund Support
- The response to ‘housing stability for low-income people’ was the highest at 78.7%.
- Housing stability was followed by ‘lottery fund scholarship project’ (74.8%) and ‘welfare for the underprivileged’ (62.9%), and ‘welfare for people of national merit’ increased by 6.4% points compared to last year. (31.7% in 2022 → 38.1% in 2023).
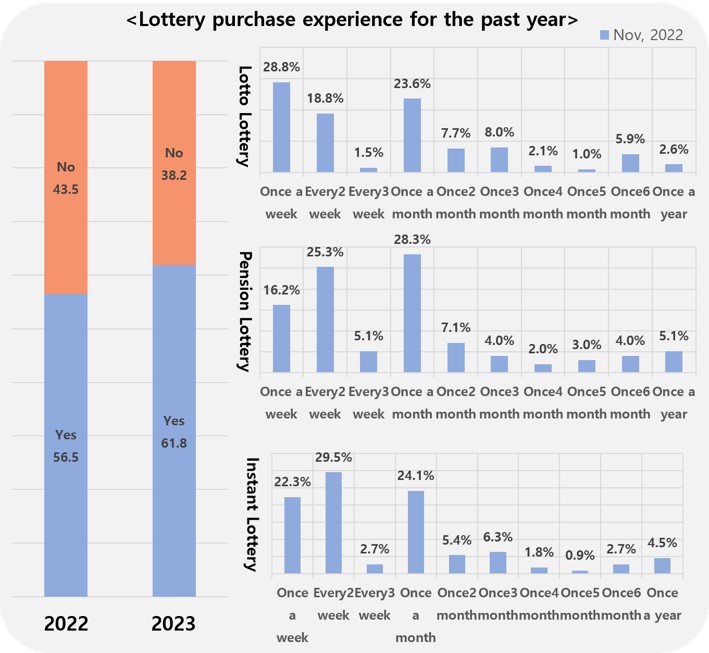
Lottery purchase experience in the last year
- The proportion of people who purchased lottery tickets within the past year was 61.8%, similar to 2021 (62.8%).
- The majority of people purchased lottery tickets weekly at 28.8%, while those who purchased tickets once a month also accounted for 23.6%. The proportion of lottery tickets purchased more than once a month was 72.7, an increase of 4.2% compared to last year (68.5%).
- The majority of people purchased pension lottery tickets once a month at 28.3%, and the largest number of people purchased instant lottery tickets once every two weeks at 29.5%.
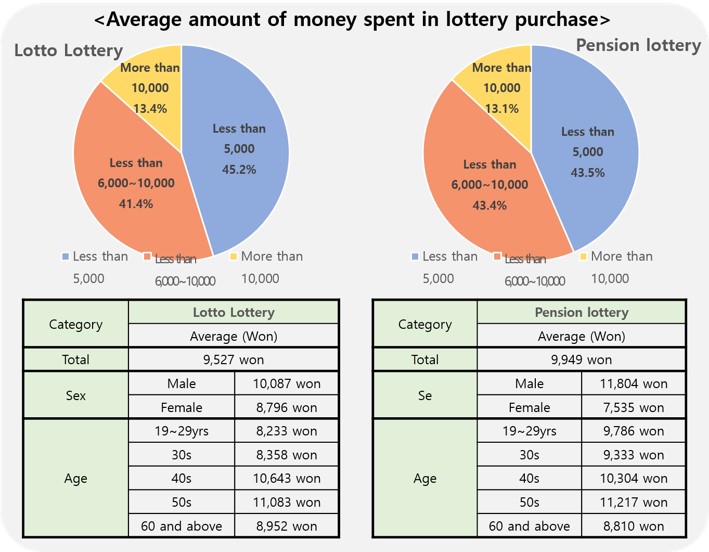
Lottery purchase amount
- Most lottery ticket and pension lottery ticket buyers spent less than 10,000 won. The proportion of buyers exceeding 10,000 won increased compared to last year (8.2% → 13.4%).
- The average lottery ticket purchase price per purchase is 9,527 won for lotto tickets and 9,949 won for pension lottery tickets.
Distribution by income quintile
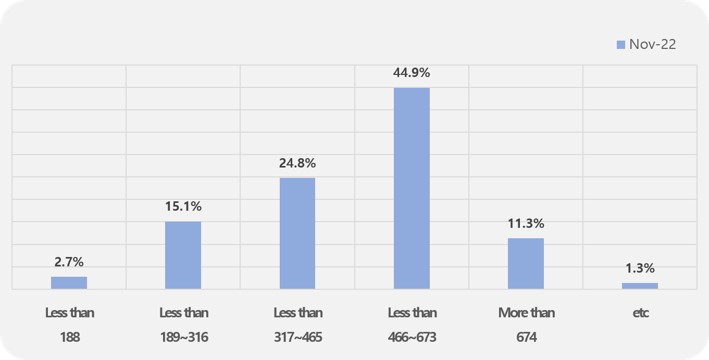
※ This survey of 1,020 men and women aged 19 years and
above was conducted by Ipsos for 30 days between September 25th,
2023 to November, 01th, 2023, (±3.1 sampling error, 95% confidence
level)