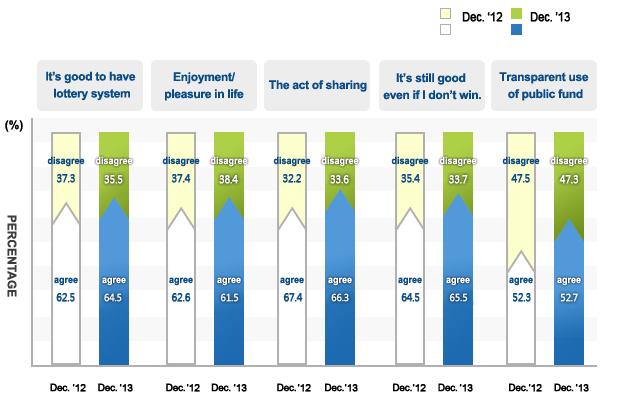
64.5% of the survey agreed with the phrase, 'It's good
to have lottery system' and this ratio is 2% higher than last
year's ratio.
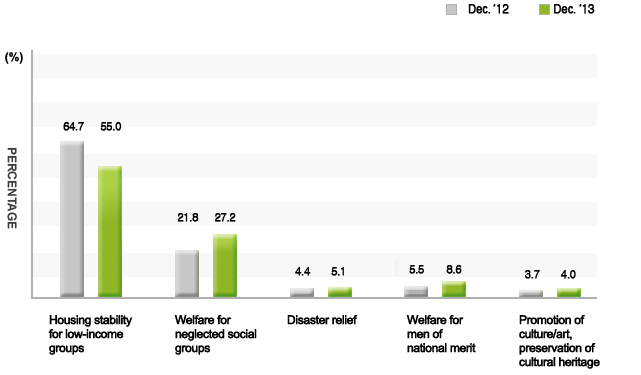
Priority of lottery fund use
55.0% of Korean adults chose 'Housing stability for
low-income groups' as the No.1 priority of lottery fund use.
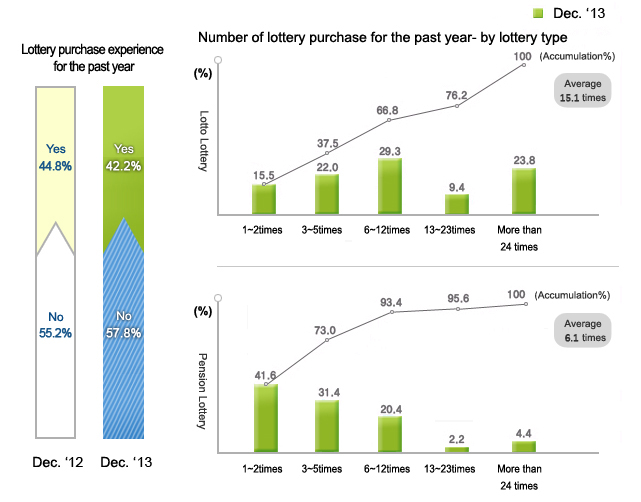
Lottery purchase experience for the past year
57.8% of the survey replied that they have purchased
lottery in the past year and this ratio is lower in comparison
with last year.
Average number of lottery purchase was 15.1 times for
Lotto Lottery and 6.1 times for Pension Lottery.
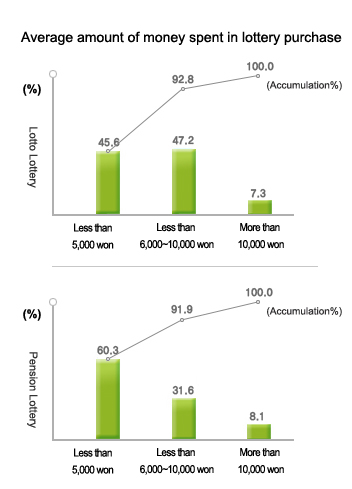
Amount of money spent in lottery purchase
About 92.8% of the purchasers of Lotto Lottery and
Pension Lottery spent less than 10,000 won per purchase.
When purchasing lottery, the average amount of money
spent per purchase was 8,874 won for Lotto Lottery and 7,119
won for Pension Lottery
Amount of money spent in lottery purchase
Category
Average (won)
Lotto Lottery
Total
8,874
Sex
Male
9,821
Female
7,299
Age
19~29yrs
7,944
30s
8,739
40s
9,303
50s
9,584
60 and above
8,250
Amount of money spent in lottery purchase-Pension Lottery 520
Category
Average (won)
Pension Lottery 520
Total
7,119
Sex
Male
7,582
Female
6,442
Age
19~29yrs
6,962
30s
7,607
40s
6,857
50s
7,324
60 and above
7,200
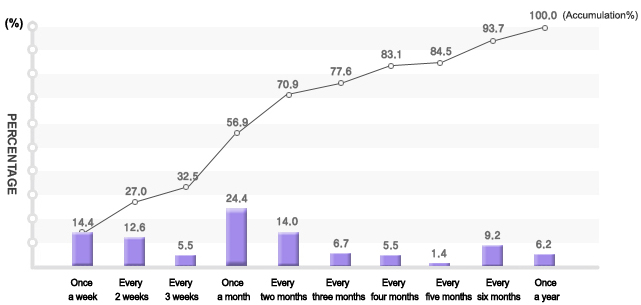
Lottery purchase frequency in 1 year
14.4% of lottery purchasers replied that they purchase
lottery weekly and this ratio is similar in comparison with
last year's.
Lottery purchase frequency for the past
year
By class (unit%)
Lottery purchase frequency for the past year
Category
People who purchase lottery
in the past year
Once a week
Every 2~3 weeks
Once a month
Less than once a month
Total
14.4
18.1
24.4
43.0
Sex
Male
23.8
21.4
24.0
35.7
Female
6.8
12.8
25.1
55.2
Age
19~29yrs
11.5
14.6
25.0
48.9
30s
16.5
18.2
26.4
38.9
40s
19.3
22.1
24.8
33.8
50s
12.5
18.0
25.0
44.7
60 and above
9.1
15.9
19.3
55.6
※ This survey of 1,000 men and women aged 19 years and
above was conducted by Gallup for 29 days between December 11th,
2013 to January, 8th, 2014, (±3.1 sampling error, 95% confidence
level)