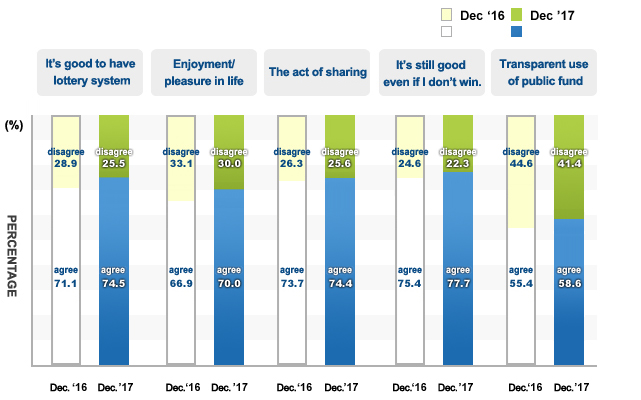
According to overall evaluation, empathy with “It's good to have lottery system” is the highest with 74.5% since 2008.
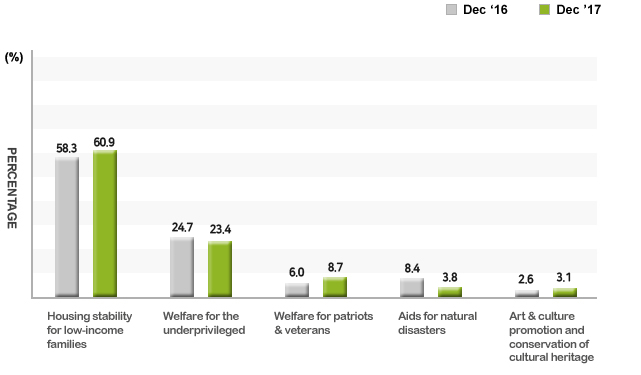
Priority of lottery fund use
The sectors which are in desperate need of lottery funds are “housing stability for low-income families (60.9%)” and “welfare for the underprivileged (23.4%)”.
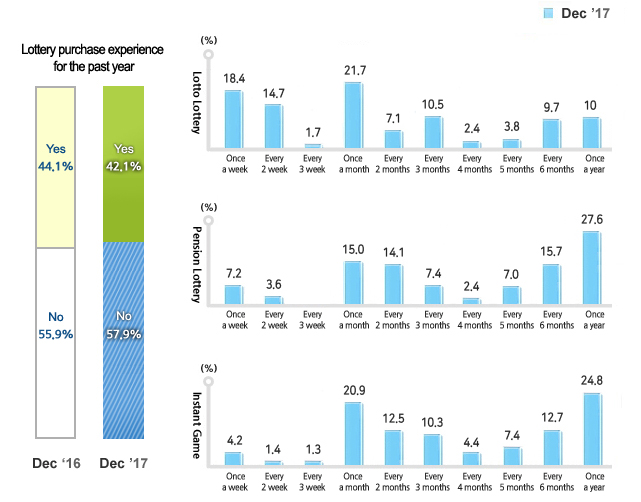
Lottery purchase experience for the past year
When asked if they bought a lottery ticket at least once for the past year, 57.9% responded ‘YES’. The figure is similar to the prior year.
When asked what lottery ticket and how often they bought, ‘once a month’ was the highest with 21.7%, followed by ‘once a week (18.4%)’ and ‘biweekly (14.7%)’ in Lotto.
In Pension Lottery and Instant Game, ‘once a year’ was the highest with 27.6% and 24.8% respectively.
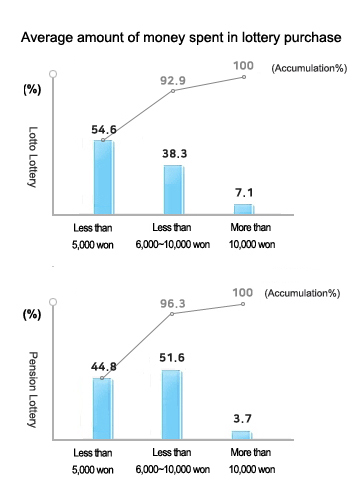
Amount of money spent in lottery purchase
Majority of Lotto and Penstion Lottery ticket buyers spent KRW 10,000 or less on average at a time.
In average, KRW 8,694 and KRW 7,609 are spent for Lotto and Pension Lottery tickets each.
Amount of money spent in lottery purchase
Category
Average (won)
Lotto Lottery
Total
8,694
Sex
Male
9,433
Female
7,501
Age
19~29yrs
8,252
30s
8,820
40s
9,015
50s
8,622
60 and above
8,574
Amount of money spent in lottery purchase-Pension Lottery 520
Category
Average (won)
Pension Lottery 520
Total
7,609
Sex
Male
8,269
Female
6,094
Age
19~29yrs
6,380
30s
7,240
40s
9,425
50s
7,921
60 and above
5,759
※ This survey of 1,039 men and women aged 19 years and
above was conducted by Gallup for 28 days between November 4th,
2017 to December, 1th, 2017, (±3.1 sampling error, 95% confidence
level)