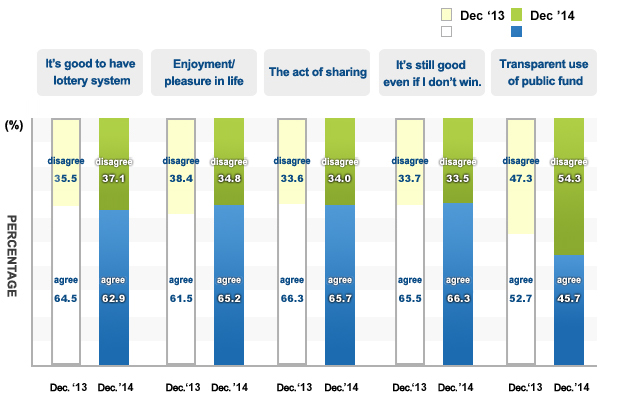
According to overall evaluation, empathy with “It's good to have lottery system” is 62.9%. The answers have been stable since it had passed 60% in 2011.
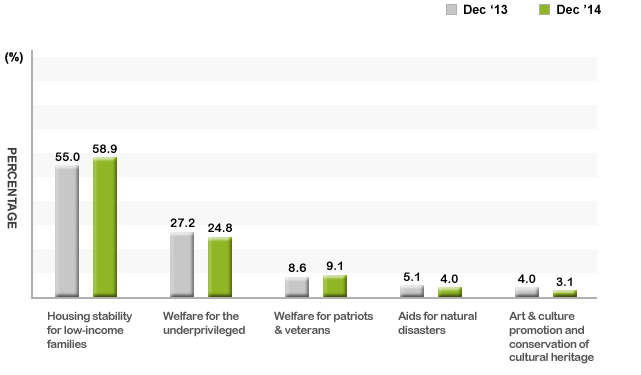
Priority of lottery fund use
The sectors which are in desperate need of lottery funds are “housing stability for low-income families (58.9%)” and “welfare for the underprivileged (24.8%)”.
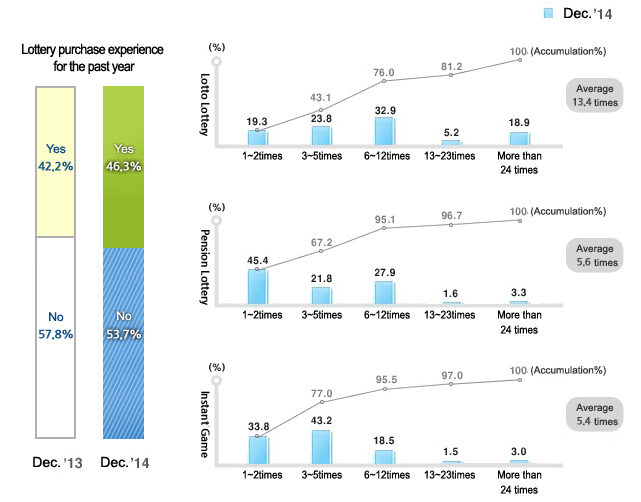
Lottery purchase experience for the past year
When asked if they bought a lottery ticket at least once for the past year, 53.7% responded ‘YES’. The figure slightly decreased from the prior year (by -4.1%).
When asked what lottery ticket and how often they bought, ‘Lotto’ was the highest with 13.4 times, followed by ‘Pension Lottery (5.6 times)’ and ‘Instant Game (5.4 times)
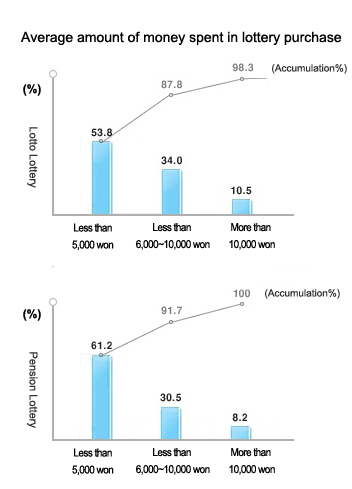
Amount of money spent in lottery purchase
KRW 10,000 or less at a time by both Lotto and Pension Lottery ticket buyers
In average, KRW 9,459 and KRW 8,014 are spent for Lotto and Pension Lottery tickets each.
Amount of money spent in lottery purchase
Category
Average (won)
Lotto Lottery
Total
9,459
Sex
Male
10,297
Female
8,187
Age
19~29yrs
7,848
30s
8,950
40s
9,921
50s
9,727
60 and above
10,555
Amount of money spent in lottery purchase-Pension Lottery 520
Category
Average (won)
Pension Lottery 520
Total
8,014
Sex
Male
9,790
Female
4,902
Age
19~29yrs
7,155
30s
7,191
40s
6,277
50s
10,129
60 and above
9,088
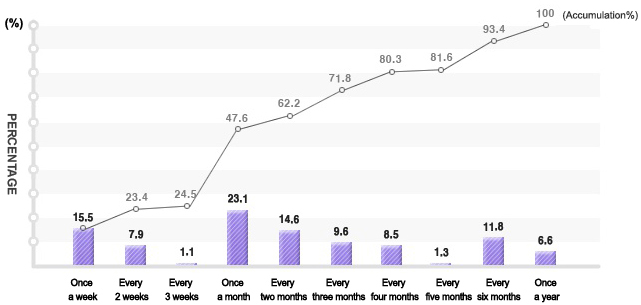
Lottery purchase frequency in 1 year
15.5% responded, “I buy a lottery ticket every week”, and the figure is similar to the previous year (14.4%).
Lottery purchase frequency for the past
year
By class (unit%)
Lottery purchase frequency for the past year
Category
People who purchase lottery
in the past year
Once a week
Every 2~3 weeks
Once a month
Less than once a month
Total
15.5
9.0
23.1
52.4
Sex
Male
21.4
10.1
28.7
39.7
Female
6.5
7.4
14.7
71.3
Age
19~29yrs
9.0
4.2
24.8
62.0
30s
14.3
12.5
26.2
47.0
40s
21.3
11.9
23.5
43.4
50s
16.3
8.3
22.8
52.7
60 and above
13.3
5.9
17.5
63.1
※ This survey of 1,000 men and women aged 19 years and
above was conducted by Gallup for 24 days between November 14th,
2014 to December, 10th, 2014, (±3.1 sampling error, 95% confidence
level)