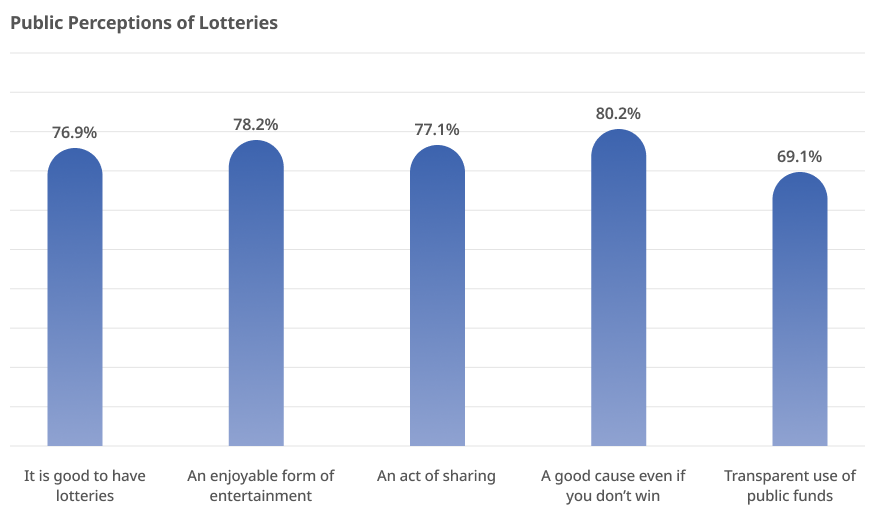
Public Perception of the Lottery
- About 7 out of 10 respondents agree that "it is good to have lotteries." When considering various aspects, 76.9% of respondents agreed with the statement that "it is good to have lotteries."
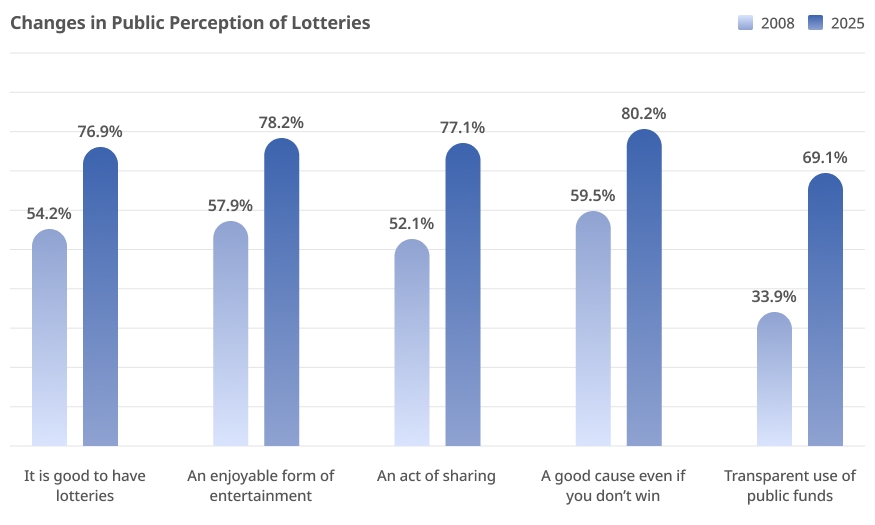
Changes in Public Perception of Lotteries
- Public perception of lotteries has improved overall over the past 17 years.
In particular, positive indicators showed significant increases, including "Transparent use of public funds" (+35.2%p), "An act of sharing" (+25.0%p), and "It is good to have lotteries" (+22.7%p).
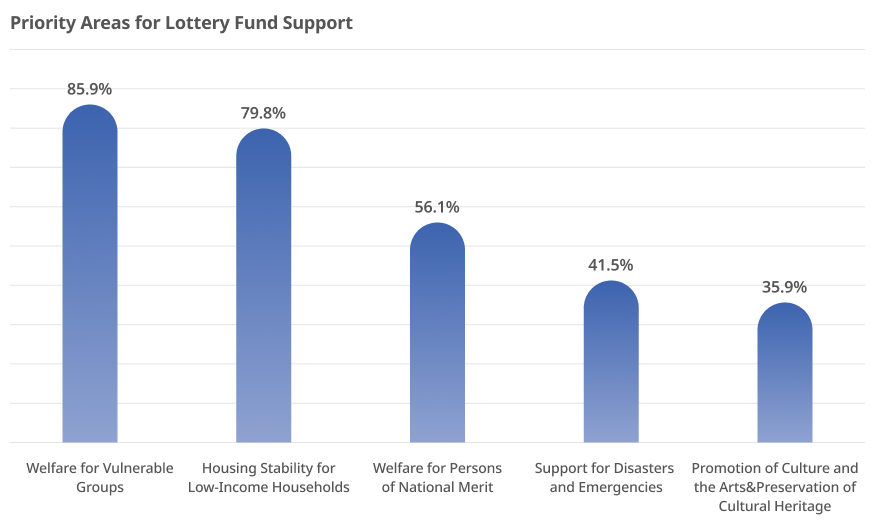
Priority Areas for Lottery Fund Support
- When respondents were asked to select up to three areas where lottery funds should be urgently allocated, "Welfare for Vulnerable Groups" received the highest response at 85.9%. This was followed by "Housing Stability for Low-Income Households" (79.8%), "Welfare for Persons of National Merit" (56.1%), and "Support for Disasters and Emergencies" (41.5%).
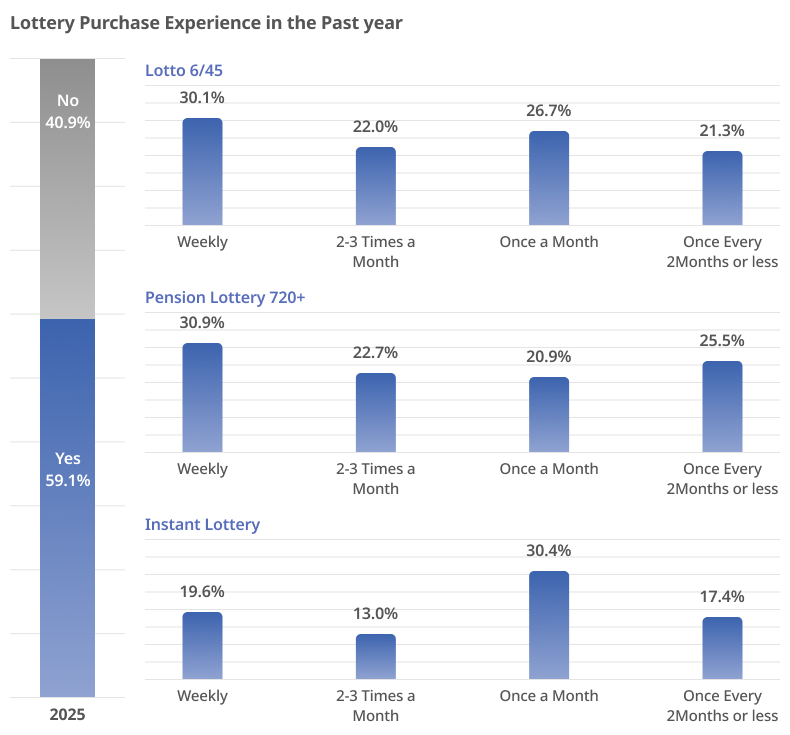
Lottery Purchase Experience in the Past Year
- In 2025, 59.1% of respondents reported having purchased a lottery ticket within the past year. Among these, the largest group were weekly purchasers of Pension Lottery, accounting for 30.9%.
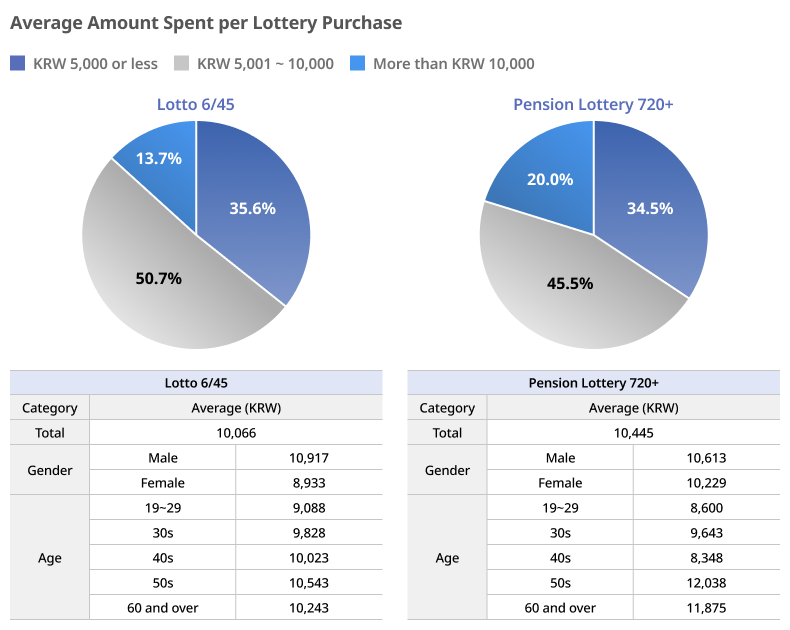
Average Amount Spent per Lottery Purchase
- Most Lotto and Pension Lottery buyers spend no more than KRW 10,000 per purchase. The average amount spent per purchase was KRW 10,066 for Lotto and KRW 10,445 for Pension Lottery.
※ This survey was conducted by Ipsos from September 27 to November 3, 2025, targeting 1,020 adults aged 19 and over nationwide (margin of error: ±3.1 percentage points at a 95% confidence level).